Business & Artificial Intelligence (BI & AI)

Business intelligence drives parking insights
Public space for parking is at a premium. Nobody wants to see streets and squares chock-a-block with parked cars. And with mobility and liveability considerations high on the public agenda, planning efficient and sufficient parking capacity in purpose-built parking facilities (PFs) is paramount.
Who needs to know about parking capacity?
All players in the mobility chain:
Event organisers need insight into parking capacity available at certain times/days to obtain a permit for the event from local authorities.
The cost of providing PFs has to be factored into new development investments. Project developers need to budget between €15,000 and €50,000 per space in purpose built PFs. Insights from comparable projects to calculate how many spaces need to be built are therefore invaluable.
Government bodies and municipalities planning infrastructure and new constructions need data to plan sufficient parking capacity for visitors and residents.
City authorities need insight into commercial parking needs to balance solutions with offices and leisure.
Navigation system providers need real-time data to direct motorists quickly to vacant parking spaces.
Q-Park has the numbers through business intelligence
Q-Park's BI platform is updated with data at 15 minute intervals. Having this level of detail in dashboards allows us to:
Categorise parking facilities (PFs), create benchmarks, and compare performance within a category;
Visualise utilisation in graphs and heatmaps, therefore enabling easy comparison and facilitating informed decisions for a range of stakeholders;
Conduct predictive analysis on peak occupancy;
Understand the average time and money spent by motorists on parking, and
Confirm the value of a PF in an urban area
Enable retail and leisure partners to create smart marketing campaigns
Calculate whether current parking capacity is sufficient to meet demand generated by current and projected commercial ventures;
Measure the effects of parking regulations, parking tariff schemes and changes to infrastructure.
Visualised data enhances smart decision-making
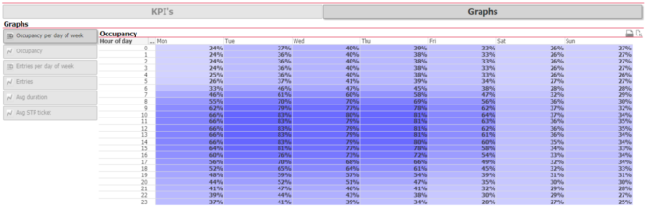
This image is the heat map for a parking facility serving a train station. We see that the facility begins to fill up on Mondays to Fridays from 6 am and slowly empties to about one-third occupancy in the evening. Because the majority of customers travel to work by train, utilisation in the weekend drops.
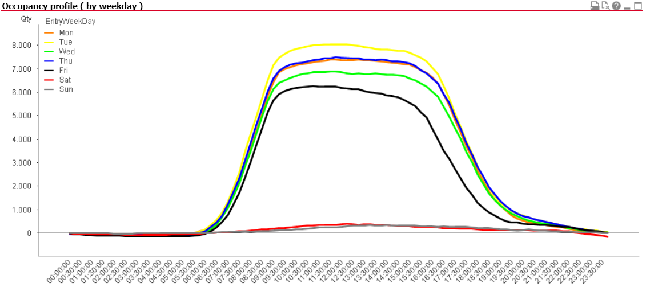
Its line graphs shows duration of stay. Data can be aggregated over different time periods - providing short- and long-term perspectives. It shows there is ample parking capacity at weekends should an event be organised near this facility.
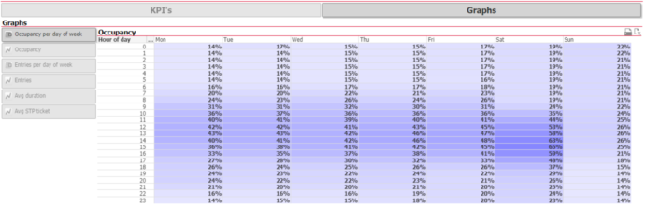
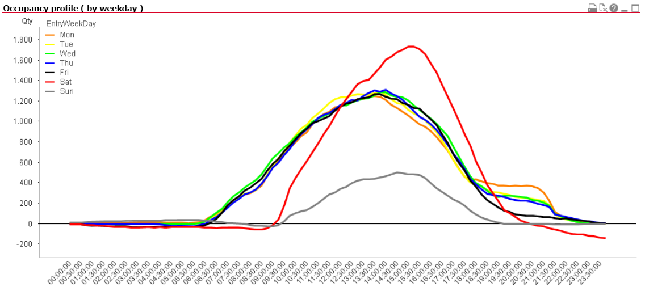
This is a heat map for a shopping area car park where occupancy rates peak on Saturday and shops are not open on Sunday. Its corresponding line graph shows that some entering the car park on Saturday also enjoy a leisure evening around this location.
In addition to occupancy rates and duration of stay, season ticket customer profiles can be distinguished from short-term parkers, and average versus peak occupancy performances over time are available.
Information value chain
Q-Park’s BI platform is more than a series of tools and graphs. It is an organic system in which professionals from different disciplines interact to add value for marketing, sales, commercial partners, project developers, municipalities and landlords.
Q-Park’s new end-to-end data management and analytics dashboards bring together data from many sources. Professionals throughout the business can query the system to gain new insights.
Q-Park and its partners now have a greater understanding of parking facility performance and customer behaviour. Using these insights, they can boost inner city area developments, streamline and redesign business processes, energise liveability concepts, discover new revenue flows, and balance risk with return.
Data-driven actions
Having BI turning data into information enables us to identify new opportunities and implement effective strategies for smart cities and landlords. These data-driven insights create a competitive advantage and offer long-term stability for the public and private sectors.
Q-Park's BI platform combines internal and external data to provide a complete picture creating insights that would otherwise not be derived from any of the data sets alone.
Next innovation = Artificial Intelligence (AI)
Q-Park’s next innovation will be to integrate augmented analytics with its BI platform. This crucial innovation will expand the expertise we share with our partners and will improve effectiveness by allowing every contributor to learn, adapt to and outthink the needs of the market, quickly and where smarter decisions are most needed.
Business Intelligence insights from comparable projects are invaluable